Average Salary Comparison by Country

Global workforce mobility and employee experience are strongly influenced by salary expectations and cost-of-living differences. In 2025, understanding salary benchmarks across countries and professions has become essential for HR leaders, organizations, and employees evaluating relocation or career opportunities.
This guide provides the latest average salary comparisons by country and job role, highlights global salary growth trends for 2025, and shares interactive tools to estimate compensation across regions. For companies managing international moves, CapRelo helps simplify global compensation alignment to ensure employees receive fair, competitive pay when relocating abroad.
*Salary data is current as of November 2025
Global Average Salary Rankings in 2025
According to the CEOWORLD 2025 Salary Index, the following countries rank highest for average monthly net salary (USD, after tax):
-
Switzerland — $8,218
-
Luxembourg — $6,740
-
United States — $6,562
-
Iceland — $6,548
-
Norway — $5,772
-
Denmark — $5,749
-
Canada — $5,188
-
Ireland — $4,729
-
Netherlands — $4,688
-
Singapore — $4,457
These countries consistently lead due to strong economies, high-value industries such as finance, technology, and energy, and robust worker protections. By contrast, some developing economies still report average wages below $500 per month.
When relocating to or from these high-salary regions, CapRelo’s data-driven relocation solutions help organizations evaluate total compensation packages while accounting for tax, housing, and cost-of-living variables.
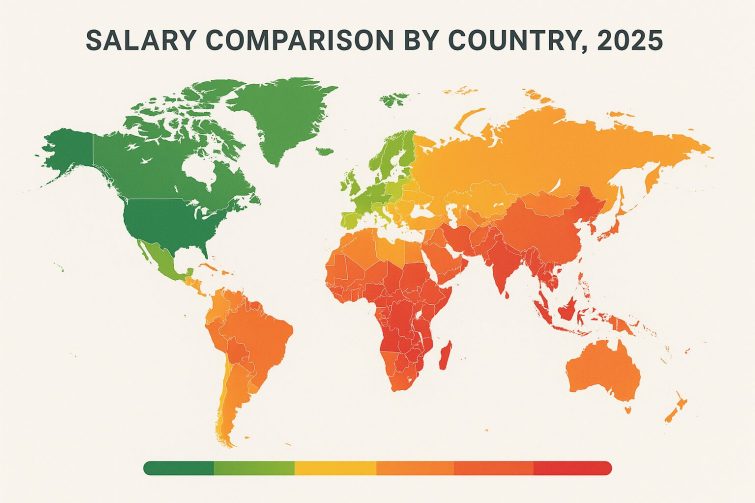
Heat map-style world map, where the colors represent average salary levels by country in 2025: Dark Green = highest salaries, light green to yellow = moderate salaries, orange to red = lower salaries.
Regional Salary Insights
Europe
-
Ireland: €3,349–€4,245 average monthly salary
-
Luxembourg: €4,086–€6,118
-
Netherlands: €3,771–€5,190
-
Portugal: Gross €1,882 (~$2,121); Net €1,412 (~$1,591)
Asia
-
China: ~$1,452 (urban non-private sector)
-
Armenia: ~$775
-
Cambodia: ~$336
North America
-
United States: $6,562
-
Canada: $5,188
Middle East
-
The United Arab Emirates continues to grow as a high-salary hub, particularly in energy and technology, often offering expatriates additional housing and benefits. CapRelo assists many employers relocating staff to this region, ensuring consistent global payroll compliance and benefits coordination.
Salary Growth Trends in 2025
Recent research shows average global salary increases are around 4.5% for 2025, providing a more realistic benchmark for wage growth across most markets.
What’s Really Happening with Wage Growth Globally?
In the technology sector, overall salary growth has moderated. For example, a 2025 global software engineer salary report shows that the average in the U.S. is around $140,010, indicating slower growth than earlier projections. Specialists in AI or cybersecurity continue to command significantly higher pay.
For roles in the renewables and green transition sectors, nearly half (48%) of professionals reported pay increases in 2025, signaling strong but variable growth rather than a uniform 10-15% across the board. Healthcare and biotechnology also continue to see above-average wage increases driven by labor shortages.
Organizations evaluating these sectors for expansion or talent acquisition can use CapRelo’s compensation benchmarking insights to plan more accurate relocation budgets and ensure equity across global teams.
Salary by Job Role in 2025
While averages are helpful, job roles strongly influence compensation:
-
Technology and IT: A recent global software engineer salary guide (2025) shows U.S. software engineers earning around US$140,000 on average, though variations by region and experience remain significant.
-
Finance: Investment bankers and actuaries remain among the highest earners, with Switzerland and Singapore offering top-tier pay levels.
-
Healthcare: Doctors and medical specialists continue to be well compensated in the U.S., Canada, and the UAE.
-
Education: Teachers in advanced economies earn two to four times as much as in developing countries, though cost-of-living and local adjustment factors vary widely.
Key Takeaways
-
Switzerland, Luxembourg, and the United States lead 2025 salary rankings.
-
Technology, renewable energy, and healthcare sectors show the strongest salary growth.
-
Interactive tools make it easier to compare the average salary by country in 2025.
For HR and mobility leaders, understanding these salary dynamics supports equitable compensation strategies and strengthens the employee relocation experience—areas where CapRelo continues to deliver global insight and operational support.
Interactive Global Salary Calculators
To provide real-time, personalized insights, use these salary calculators. These tools will allow you to compare salaries by role, region, and industry in real time.
-
iSalary — AI-powered global salary calculator across 195+ countries
-
RemotePeople Global Salary Calculator — Compare ranges by country and industry
-
SalaryExpert Calculator — Salary data by city and job title
-
Playroll Salary Tool — Benchmarks based on Glassdoor and LinkedIn data
-
Gloroots Salary Calculator — Median salary data across 45+ countries
-
PopaDex Disposable Income Calculator — Adjusts for taxes and cost of living
-
Robert Half 2025 Salary Calculator — Role-specific salary ranges by region
CapRelo regularly analyses data from these and other sources to guide clients in developing globally competitive compensation and relocation frameworks.
Frequently Asked Questions (FAQ)
- What is the highest-paying country in 2025?
Switzerland leads in 2025 with an average monthly net salary of $8,218. - Which industries are seeing the fastest salary growth in 2025?
Technology, renewable energy, and healthcare show the strongest wage growth, reflecting ongoing digital transformation and sustainability investment worldwide. - How do salaries in Europe compare to Asia in 2025?
European countries such as Luxembourg, Switzerland, and Ireland report average monthly salaries above €3,000, while many Asian nations like China (~$1,452) and Cambodia (~$336) remain below $2,000 per month. - Where can I find salary benchmarks by job title?
Interactive tools like iSalary, SalaryExpert, and Robert Half’s 2025 calculator provide detailed benchmarks by role and country. - Why do salaries vary so much between countries?
Salary levels depend on economic strength, taxation, demand for specialised skills, and local cost-of-living factors. Companies managing international teams often use CapRelo’s global data insights to balance pay scales and maintain consistency across markets.


